AnyClip conducted a video business survey to better understand what’s on the minds of publishers in the critical year for online video business. The survey, which included 500 executives from digital media companies within the comScore top 5000, helped us to see where these publishers are focusing their attention, spending their dollars, and finding their challenges. Some findings to call out are:
- 82.8% of publishers claim video to be a primary revenue driver for their media business.
- 78% of publishers have a formal video strategy in place.
- Almost two-thirds (57.8%) of publishing executives claimed controlling cost to be their single-biggest challenge for 2021.
- Less than half (43%) of media executives claimed to have a good idea of the size of their total combined video audience across their owned and social media channels.
- 27% of publishers say they are frequently wrong or surprised by what their audience is actually interested in watching, with more than 36% claiming that if they had better access to insights, their strategy/execution would be stronger.
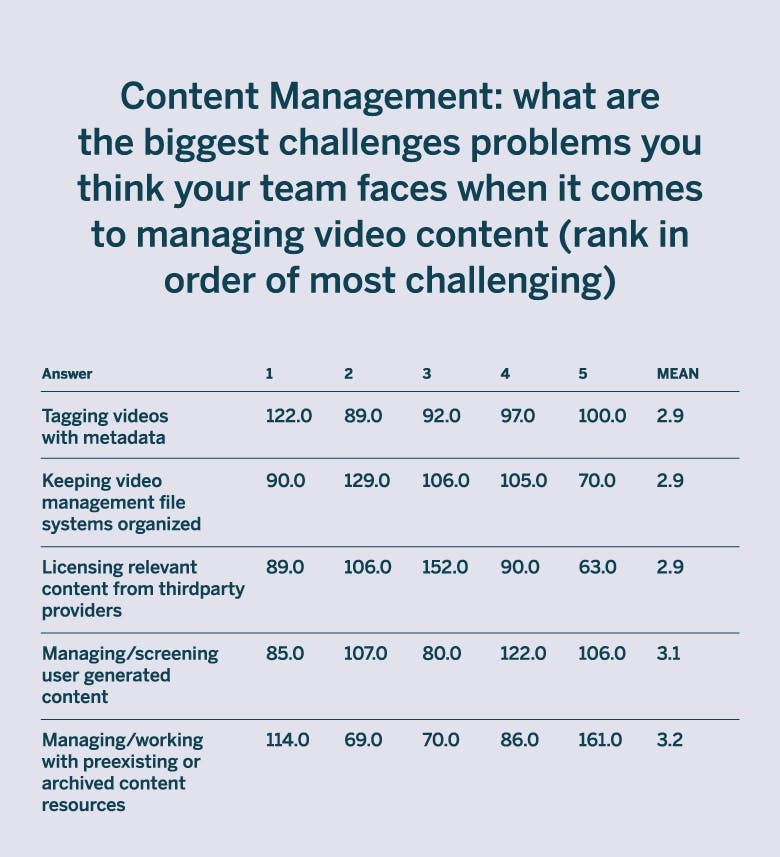
- 24% of publishers reported that tagging videos with metadata and managing/working with preexisting or archived content resources (23%) were their two biggest challenges in working with video assets.
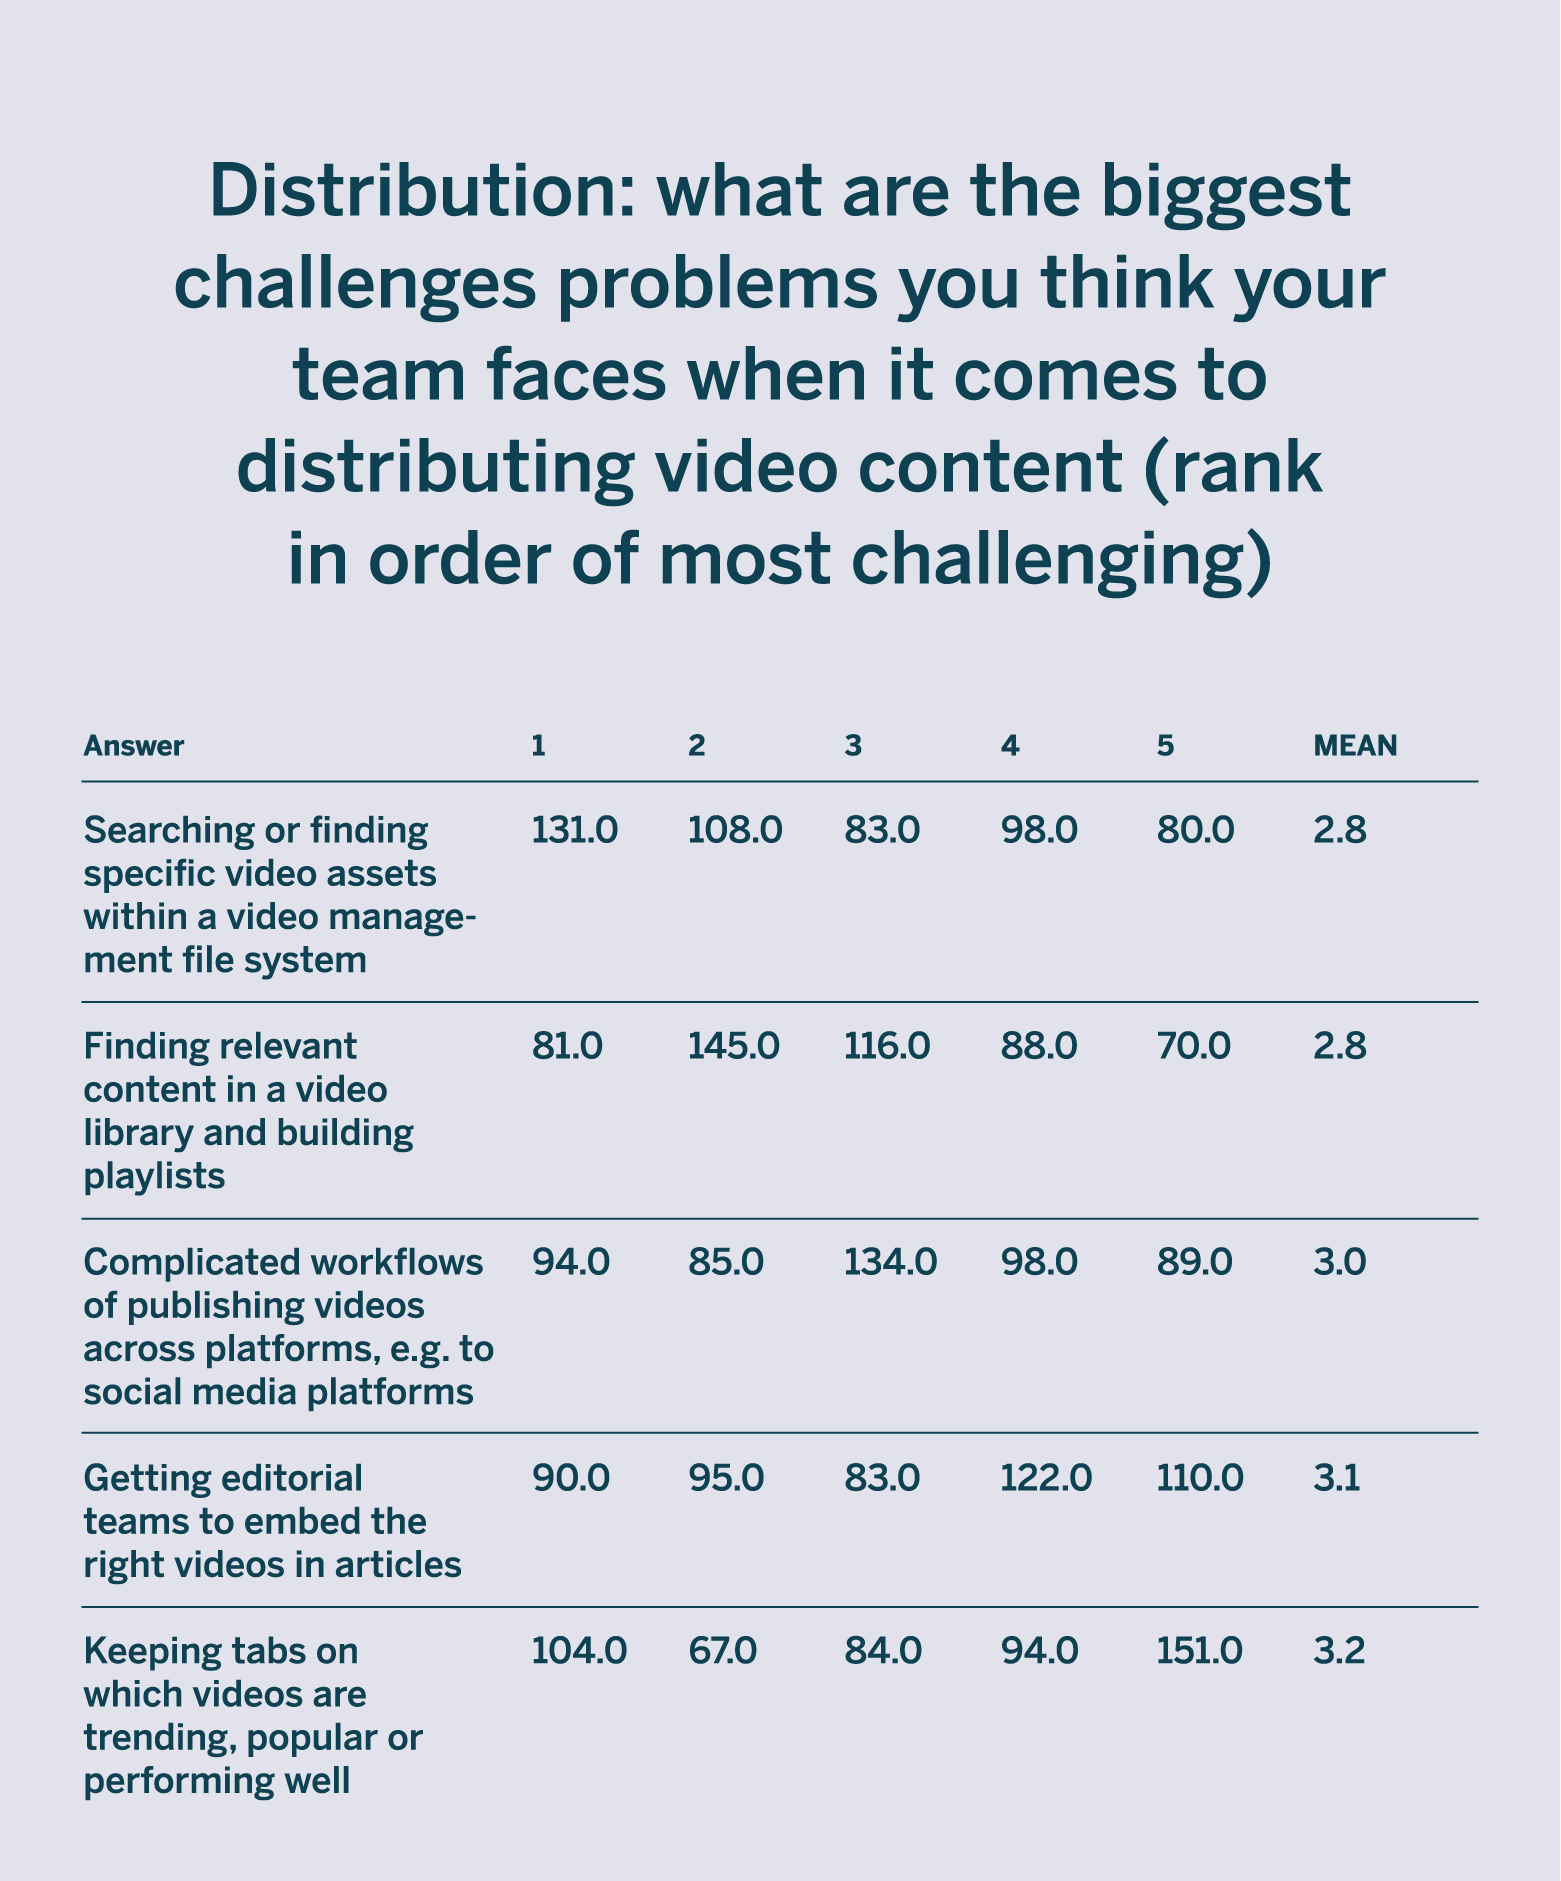
- 26% of publishers reported that searching for specific video assets within an existing video management file system is their biggest challenge in distributing video content, followed by tracking video performance (20%).
- Only 36% of publishers use video performance and engagement metrics to validate and pitch video solutions to advertisers.
Continue on for a full report of our findings.
How much does video contribute to your site’s overall revenue/business?
Video is the main source of revenue for 82.8% of respondents.
Do you feel your site has a formal strategy in place to grow video audience, revenue or both for 2021?
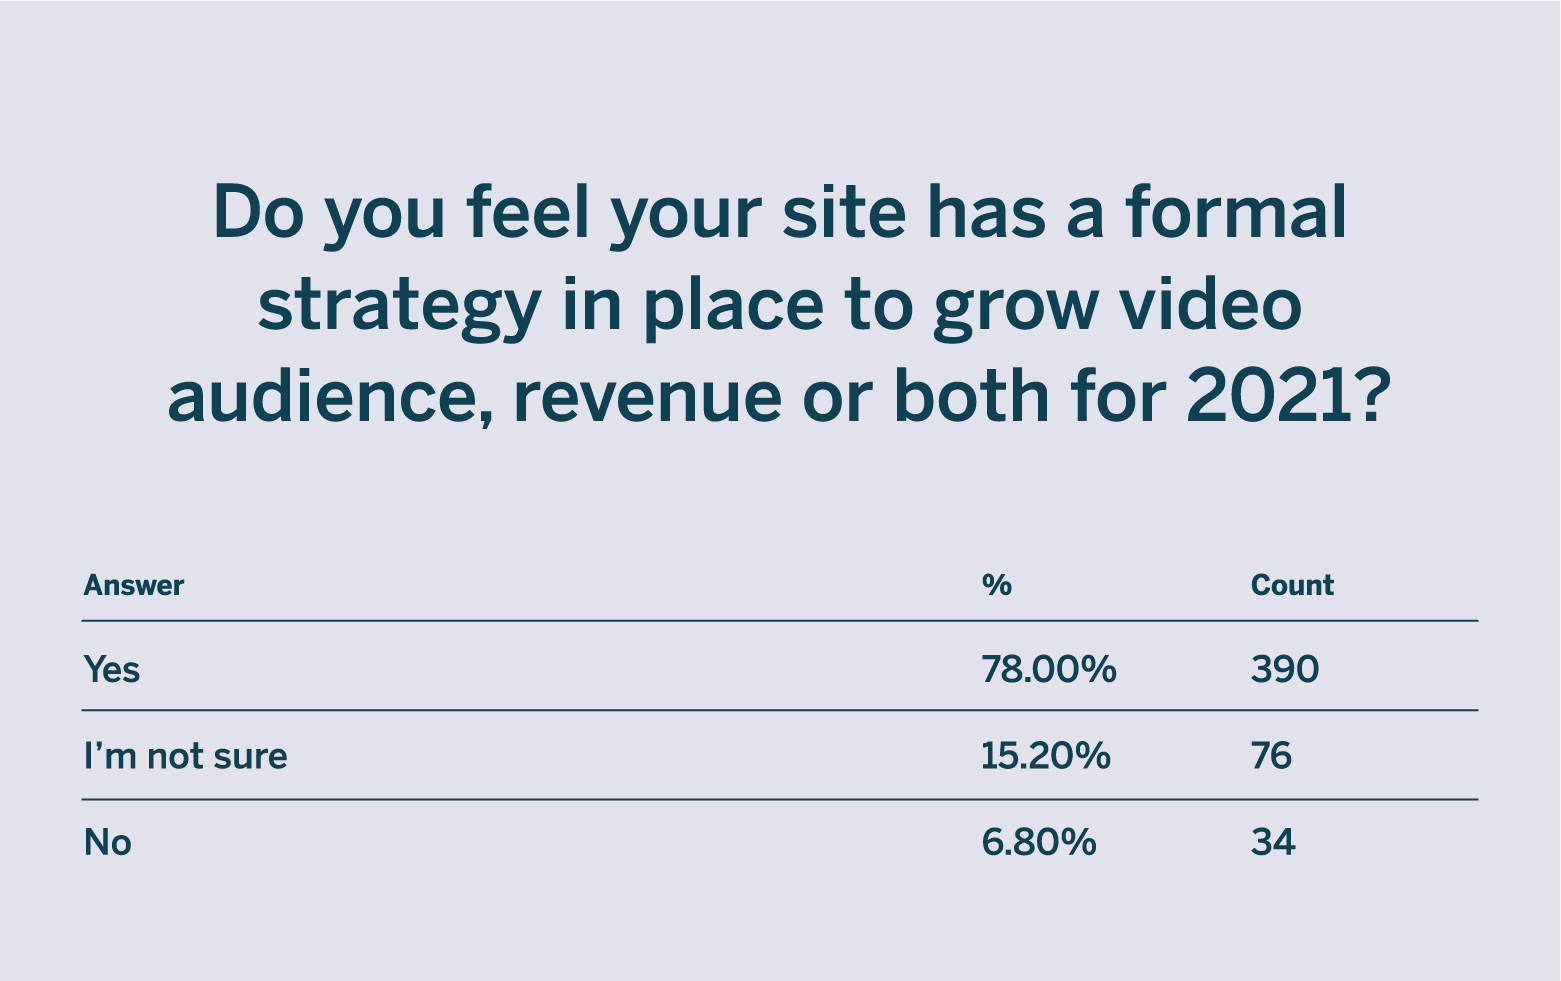
78% of respondents have a formal video strategy set for 2021.
How is video being leveraged to engage your overall audience?
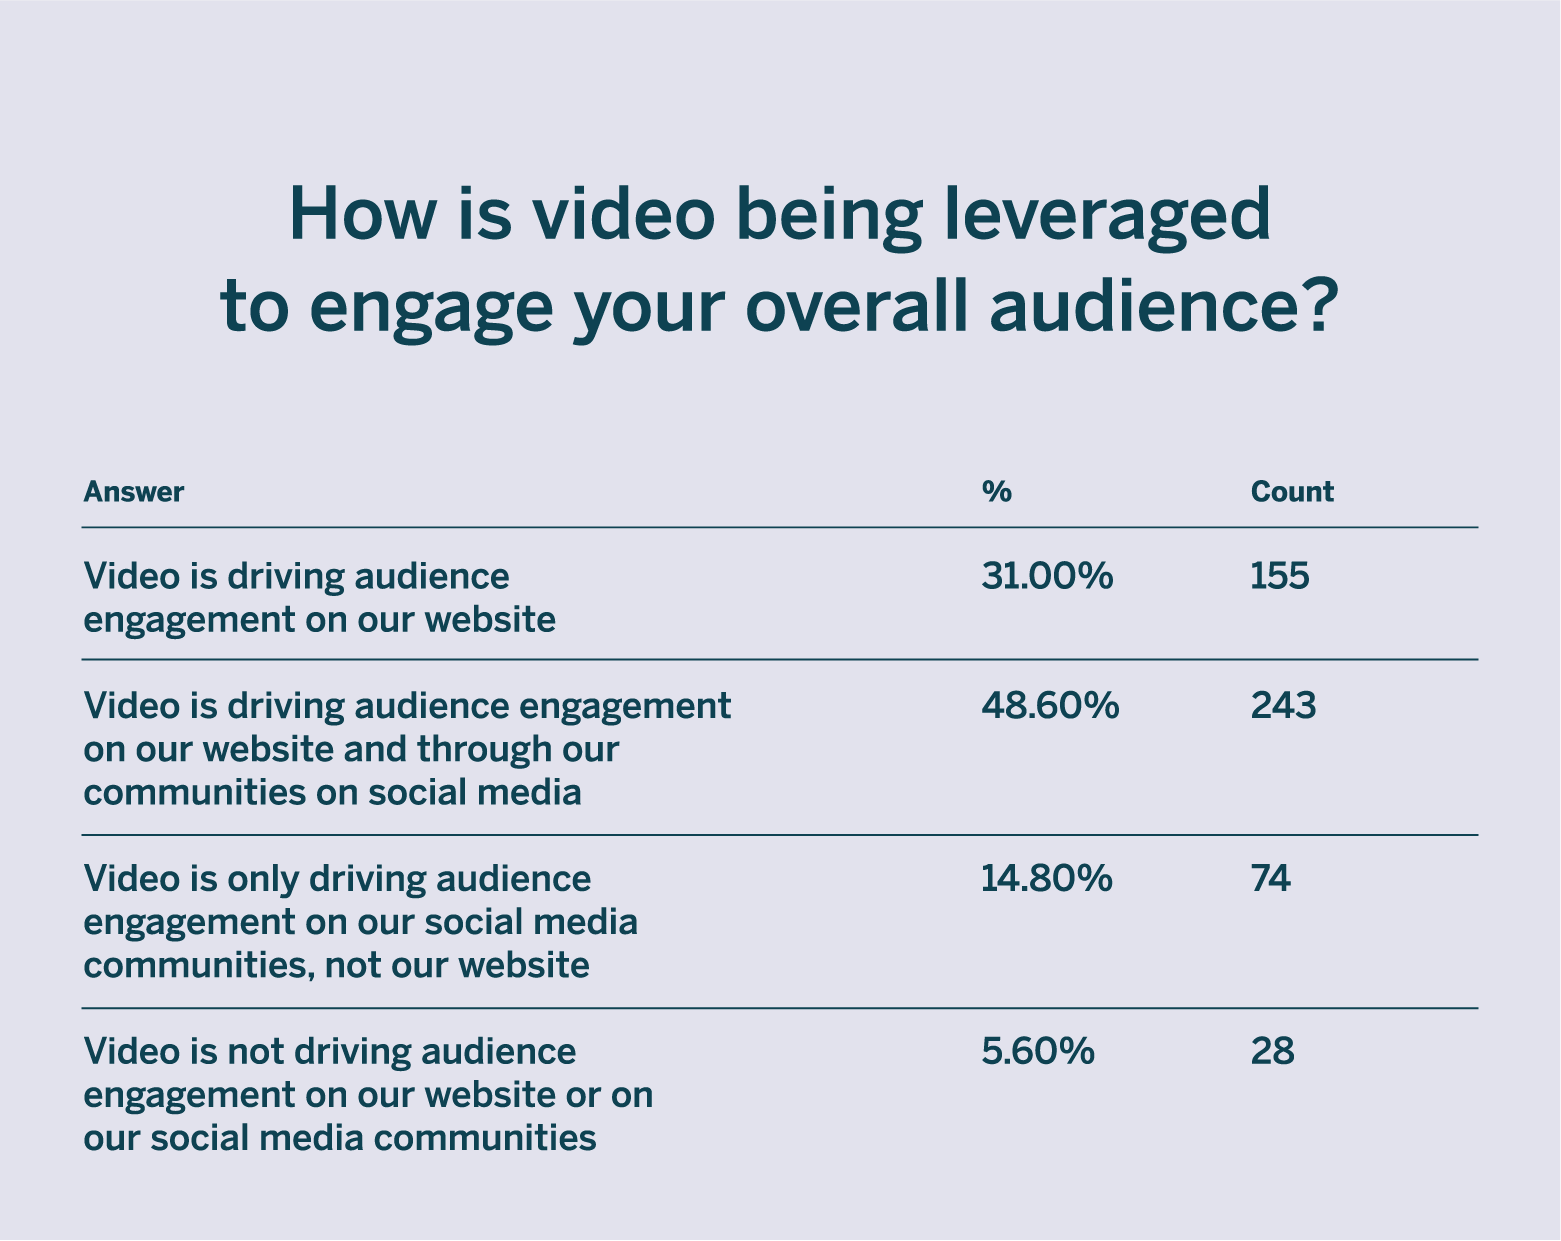
All but 5.6% of respondents claimed that video is driving audience engagement on their website and/or social media.
Which internal team do you think is most responsible for delivering success in your media company’s video business?
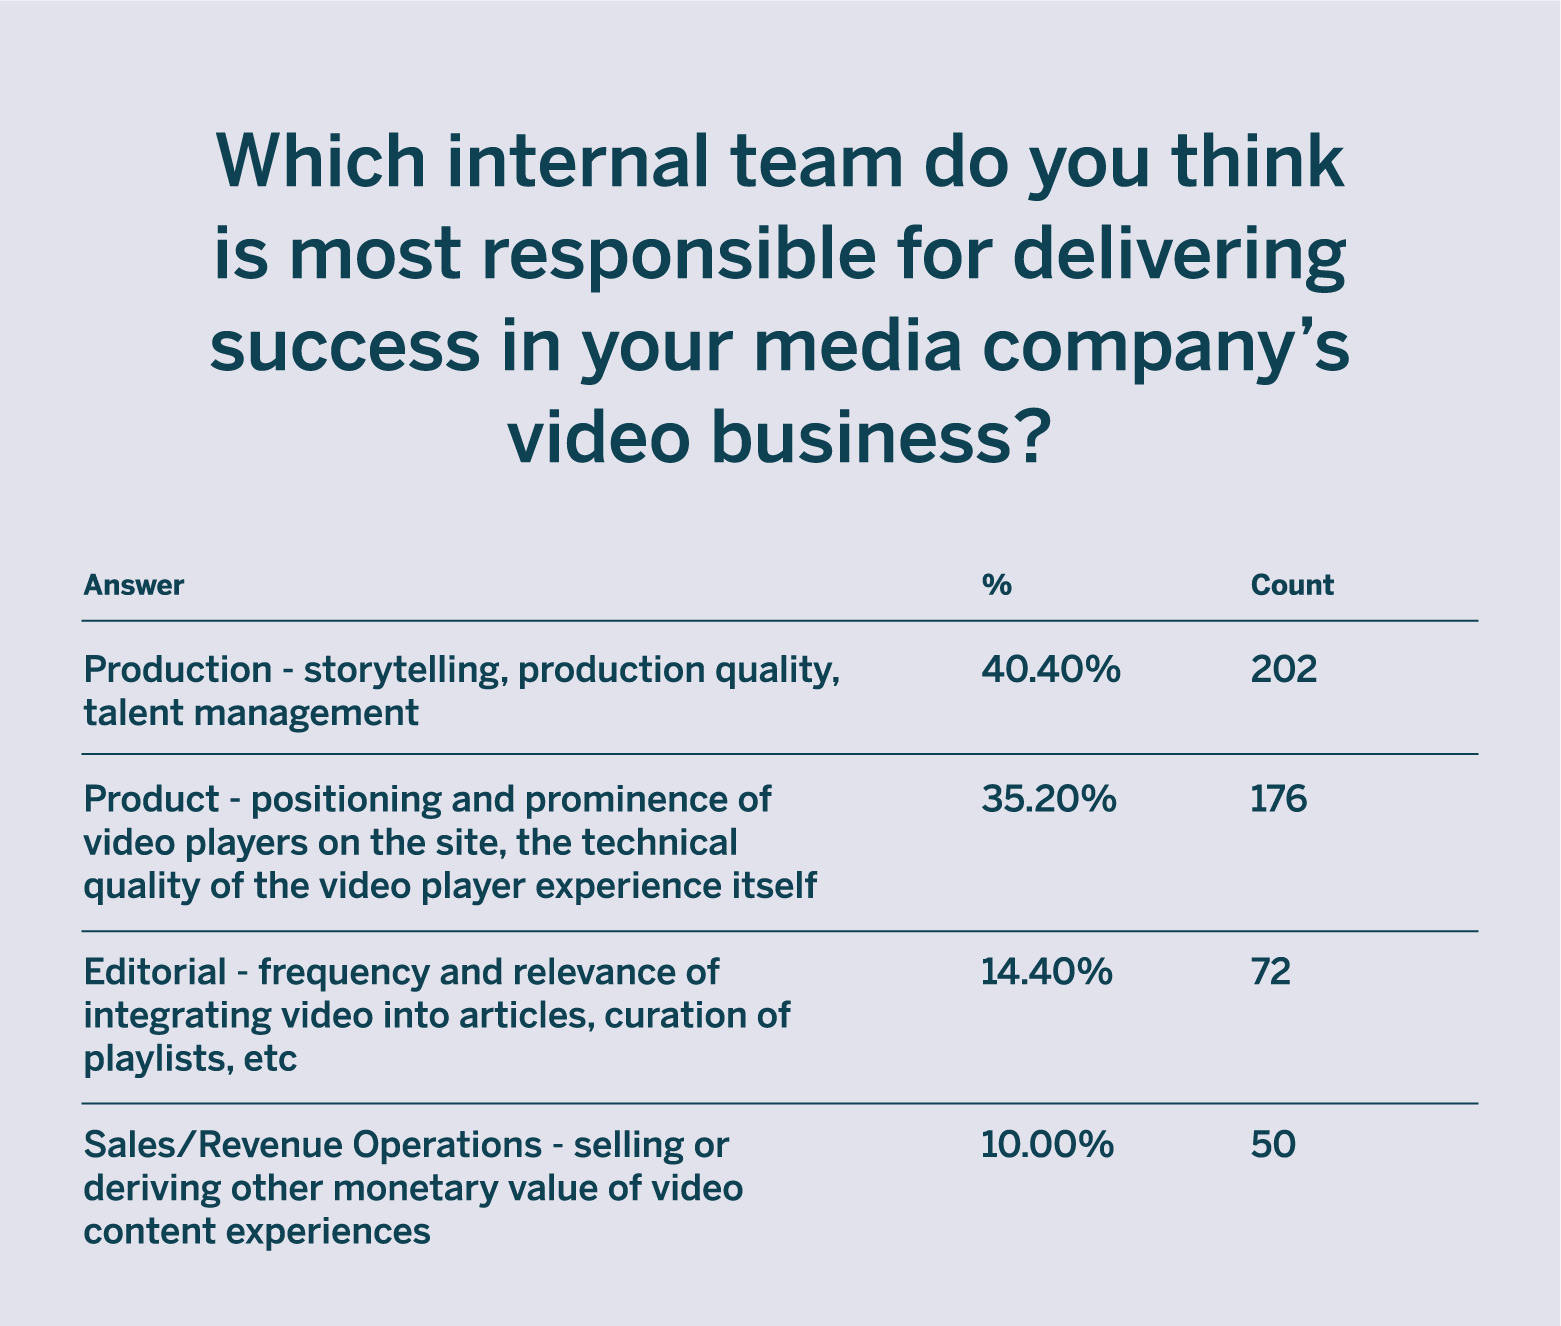
Production (40.4%) and Product (35.2%) teams are the most responsible for delivering success to the video business.
Which internal team do you think is most influential over setting direction or making decisions for you media company’s video business?
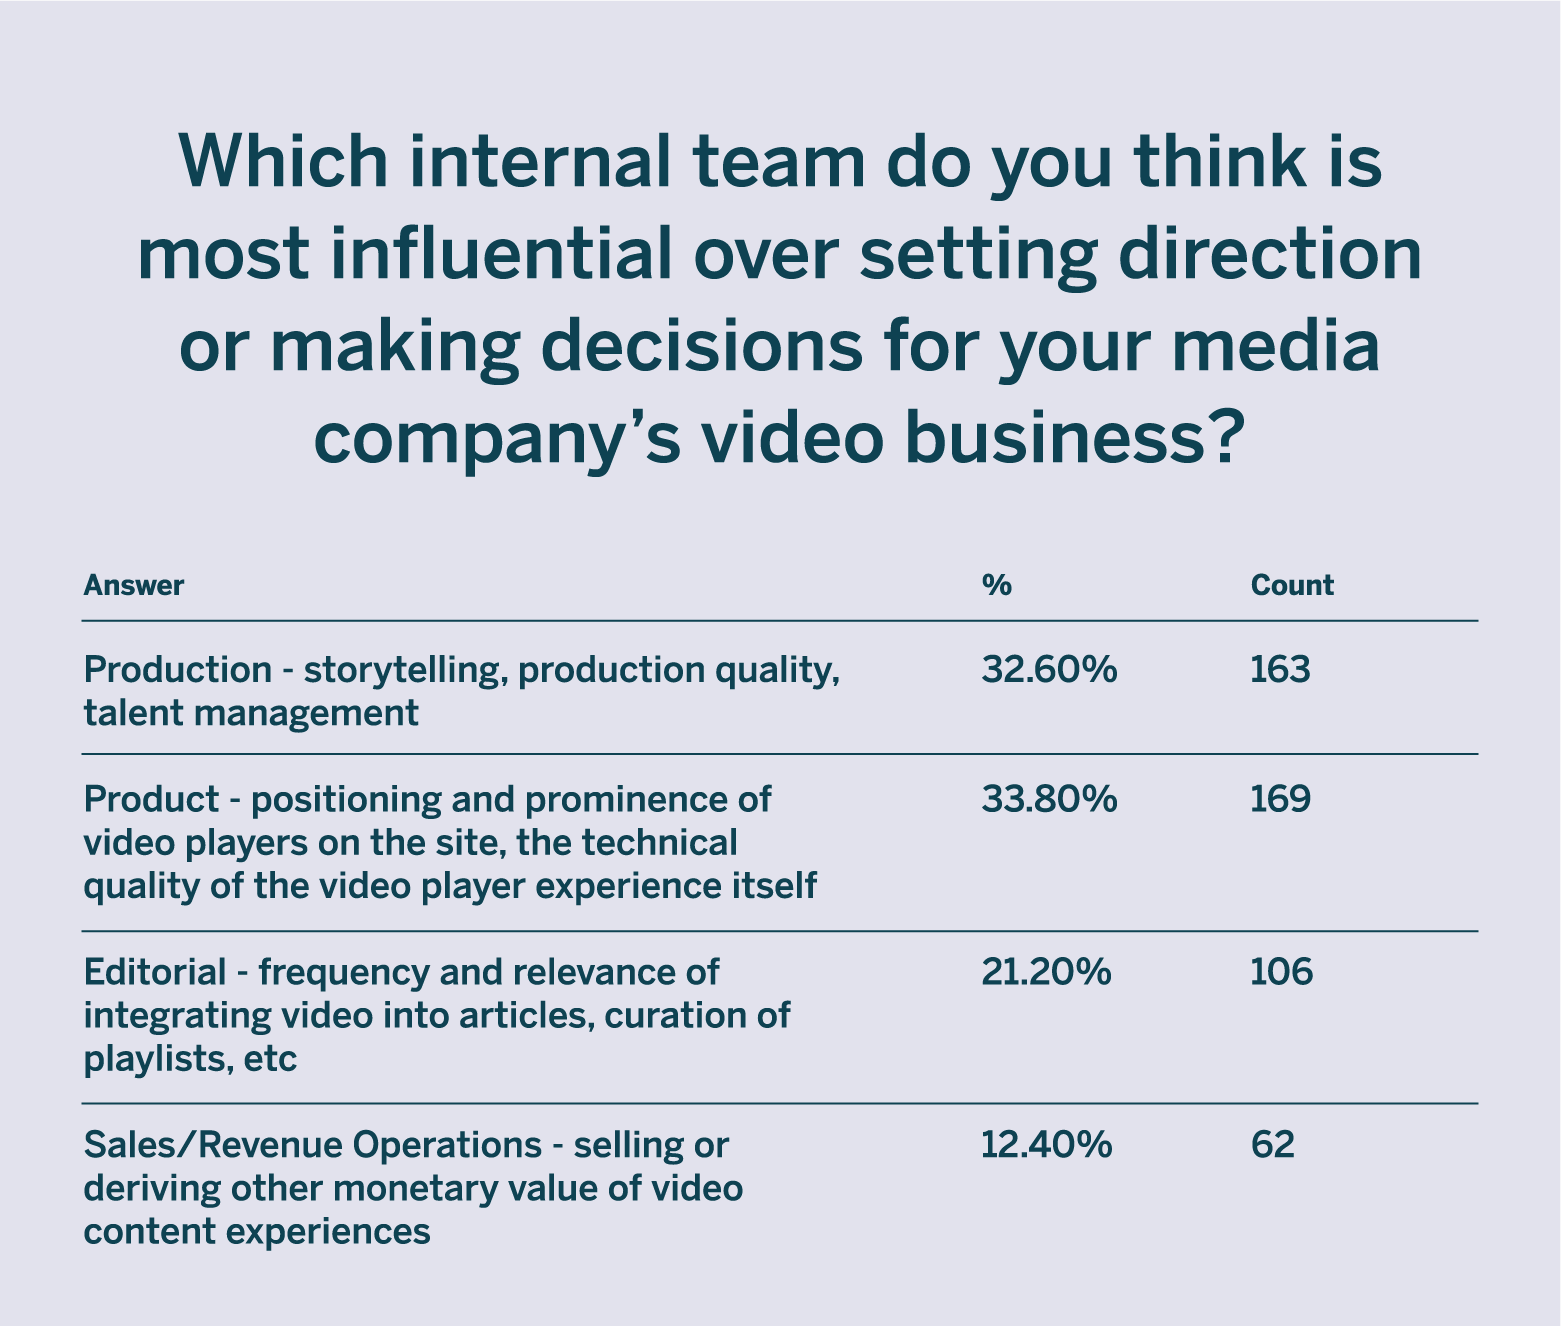
Production (32.6%) and Product (33.8%) teams are the most influential for setting direction and decision making for the video business.
The following questions asked respondents to rank all answers in order of most challenging with 1 as the most challenging and 5 being the least challenging.
Content Management: What are the biggest challenges your team faces when it comes to managing video content?
Distribution: What are the biggest challenges/problems you think your team faces when it comes to distributing video content?

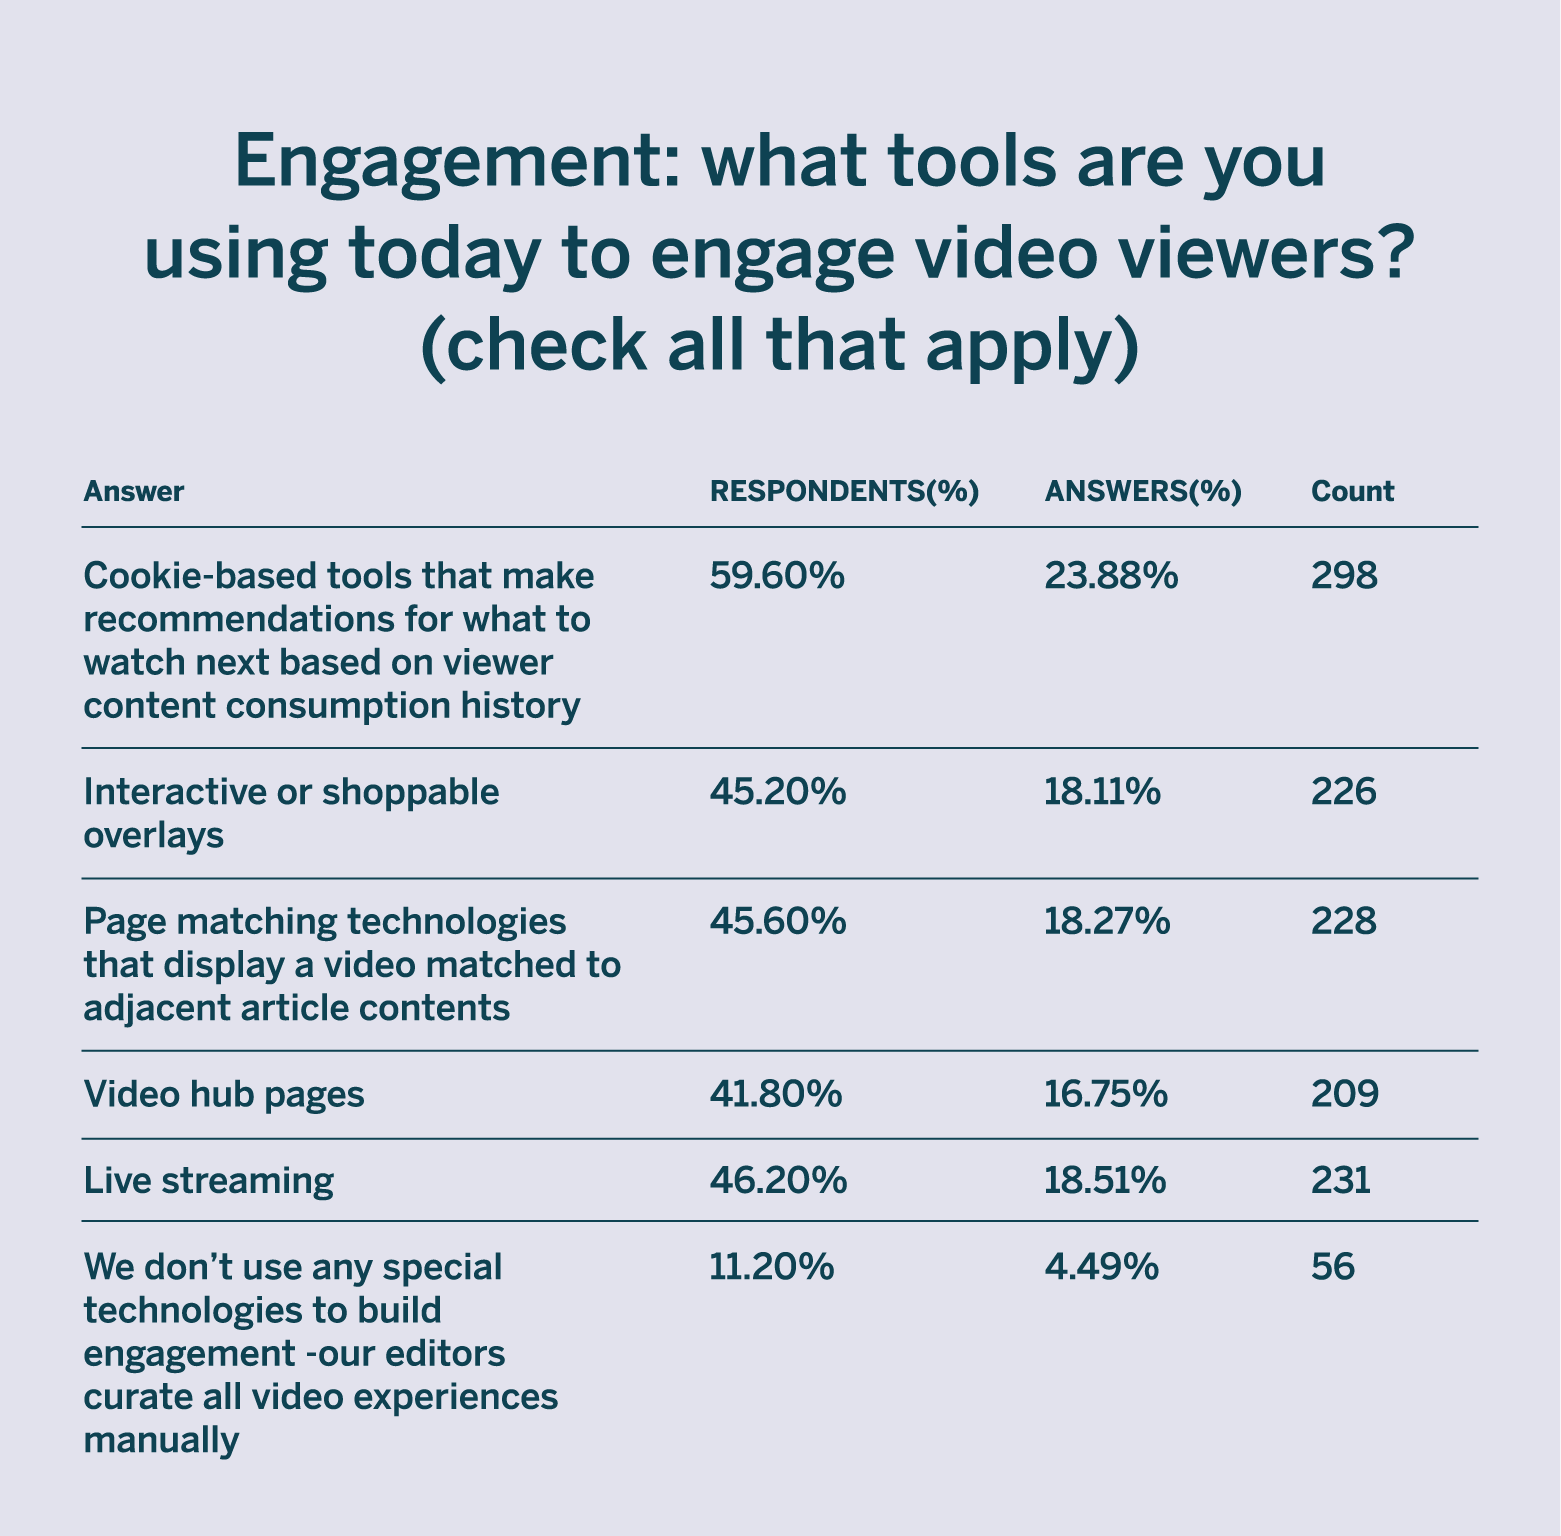
The following question asked respondents to check all that apply.
Engagement: What tools are you using toady to engage video viewers?
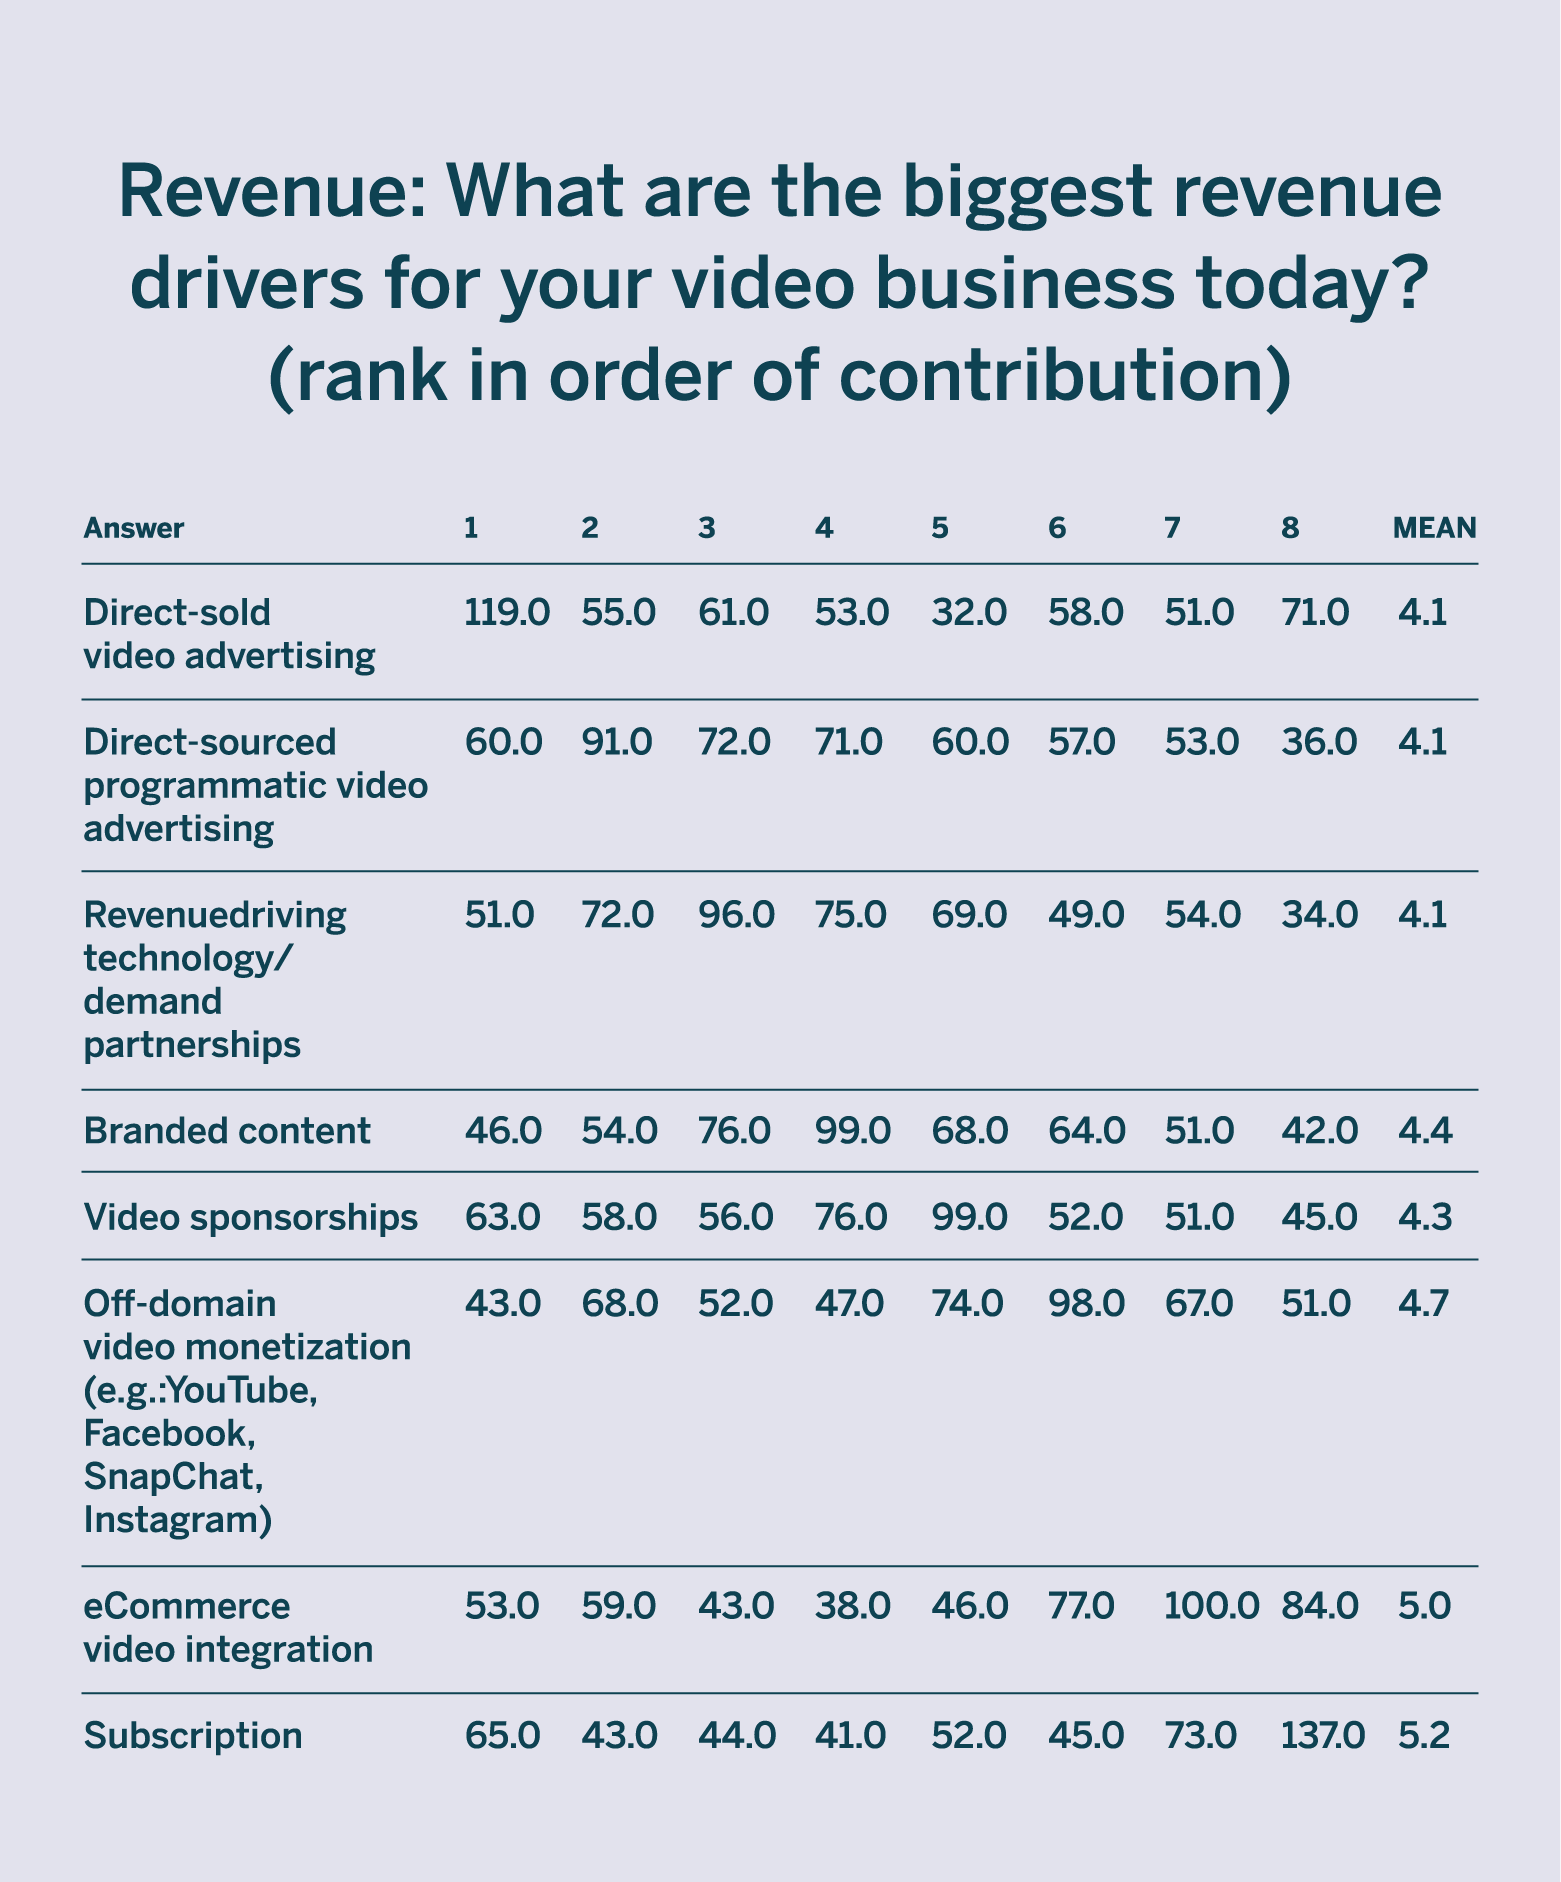
The following question asked respondents to rank in order of contribution toward revenue with 1 being the biggest driver and 8 being the least.
Revenue: What are the biggest revenue drivers for your video business today?
Methodology of our Video Business Survey:
From 12/22/20-12/24/20, we surveyed 500 digital media executives located in the United States, included in the comScore 5000 with a director title or above at companies who create video content or sell video advertising in any way. Age groups 18 – 24 (14.6%), 25 – 34 (26.8%), 35 – 44 (35.2%), 45 – 54 (12.6%), > 54 (10.8%) Gender breakdown Female (42.0%), Male (58.0%)


